Ona Intelligence Layer
Backend infrastructure that absorbs unreliable energy data and exposes stable intelligence your systems can depend on.
Overview
Ona is an intelligence layer for energy systems. It connects to your inverters and energy assets via standard APIs, serving as complete middleware for the data pipelines necessary to run ML/AI models. These models can be called via API or SDK, embedded directly within your existing business logic.
This is a platform that supports your technical roadmap, rather than forcing you to adjust your business logic to fit the platform’s idiosyncrasies. Integrate once, consume intelligence through the interfaces you already use.
Ona is not a single product — it is three layers that work together:
- ODSE — Open Data Schema for Energy. The open specification and reference runtime that defines how raw device telemetry is ingested, normalised, and validated across OEM formats and industrial protocols. github.com/AsobaCloud/odse (CC-BY-SA 4.0 / Apache 2.0)
- SDK — The public integration surface. Three live APIs that expose stable intelligence endpoints your systems integrate against once. github.com/AsobaCloud/sdk (MIT)
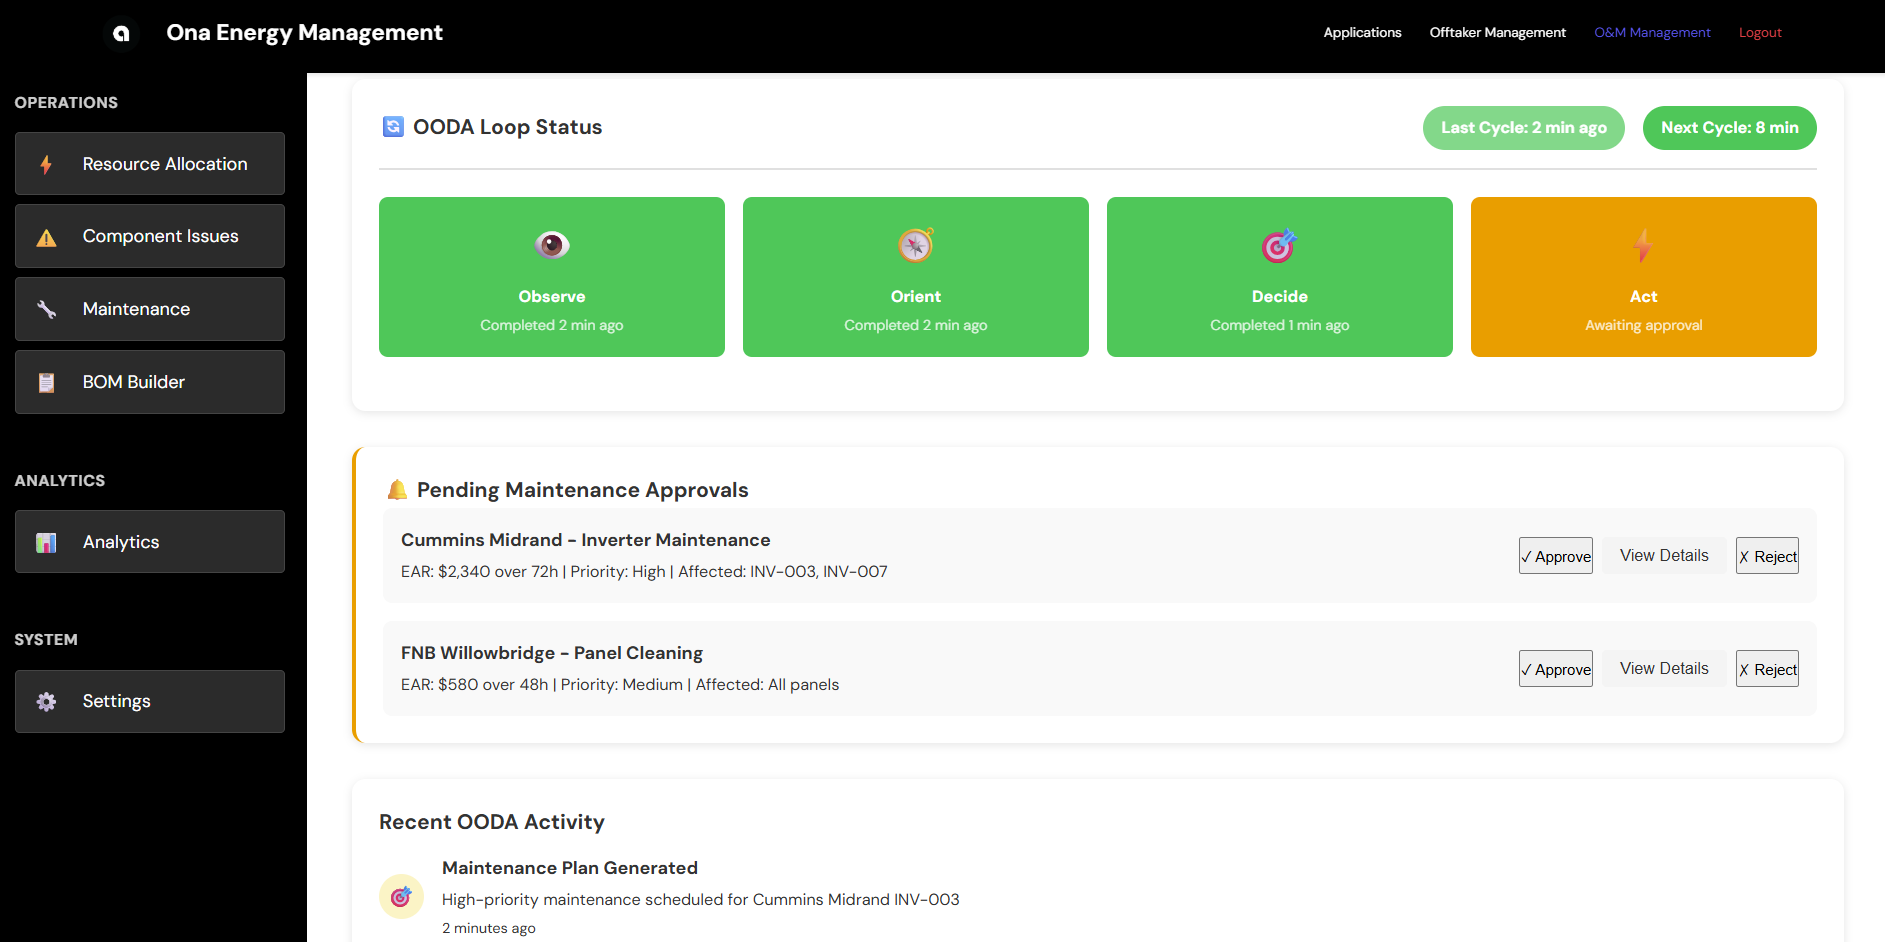
- Core Platform — The deployed Ona platform on AWS af-south-1. Fault detection, forecasting, prognostics, OODA diagnostics, model training, and the full analytics stack that the SDK sits in front of.
Capability Matrix
Where each capability lives in the stack. ● Full · ◐ Partial · ○ Absent
| Capability | ODSE | SDK | Core Platform |
|---|---|---|---|
| Ingestion & Data | |||
| Inverter telemetry (HTTP poll, 8 vendors) | ● | ● | ● |
| On-prem agent / push API for closed networks | ● | ◐ | ● |
| SCADA / IEC 61850 substation connector | ● | ○ | ◐ |
| MQTT / OPC-UA industrial connector | ● | ○ | ◐ |
| Smart-meter / AMR ingest (Eskom-compatible) | ● | ◐ | ◐ |
| Bulk historical CSV import + reject reports | ● | ○ | ● |
| Standardised data schemas (ODSE-equivalent) | ● | ● | ● |
| Detection & Analytics | |||
| Fault register + state-machine + revenue-impact (ZAR) | ○ | ● | ● |
| Predictive-maintenance signals (snapshot) | ○ | ● | ● |
| Performance-opportunity engine (11 deterministic detectors) | ○ | ◐ | ● |
| Plant soiling & cleaning recovery-gain audit | ○ | ● | ● |
| Asset prognostics (remaining-useful-life / degradation) | ○ | ● | ● |
| BESS state-of-health + warranty triggers | ○ | ● | ● |
| Generation + revenue forecasting (P50/P90) | ○ | ● | ● |
| Drone / thermal imagery diagnostics | ○ | ○ | ○ |
| Operations / CMMS | |||
| Work-order / CMMS workflow (open → close + chain audit) | ○ | ○ | ○ |
| Parts inventory & stock movements | ○ | ○ | ○ |
| Technician roster, skills & dispatch | ○ | ○ | ○ |
| Preventive-maintenance scheduler | ○ | ● | ● |
| Field-mobile / offline PWA for technicians | ○ | ○ | ○ |
| Site commissioning chain (acceptance → handover) | ○ | ○ | ○ |
| Access & UX | |||
| Dashboards, KPI roll-ups, exports | ○ | ● | ● |
| Multi-tenant auth + roles + RBAC | ○ | ◐ | ◐ |
| Contractor / asset-owner self-service portal (tokenised) | ○ | ○ | ○ |
| Public SDK for third-party integrators | ● | ● | ● |
Notes:
- Performance-opportunity engine: the SDK exposes maintenance signals and fault snapshots; all 11 deterministic detectors run at the Core Platform layer.
- Multi-tenant RBAC: admin/super-admin JWT role structure is live; full tenant isolation is in progress.
- CMMS, technician dispatch, field-mobile, and self-service portal are not on the current roadmap. These are addressed via integration with esums where required.
How the Layers Work Together
Raw telemetry arrives in inconsistent formats across OEMs and protocols. ODSE absorbs that at the ingestion boundary — enforcing schema contracts, normalising across Huawei, Enphase, SCADA, MQTT, OPC-UA, and Eskom AMR formats, flagging data quality issues before they propagate. Nothing reaches the analytics layer without passing through that schema validation.
The Core Platform runs the intelligence stack on top of clean, schema-validated data: fault detection and OODA diagnostics, soiling and recovery-gain analysis, asset prognostics, BESS state-of-health, P50/P90 forecasting, and a model training pipeline with challenger/production promotion and auditable rollback.
The SDK exposes that intelligence through stable API contracts. Your systems integrate once against the SDK surface. The underlying models improve, retrain, and iterate without breaking your integration.
What It Replaces
Without this stack, teams build:
- Per-OEM data cleaning pipelines
- Feature engineering logic that breaks when OEM firmware updates
- Model deployment and retraining processes
- Glue code between data sources and analytics
- Bespoke anomaly detection built against generic specifications rather than actual data contracts
Ona centralises all of this behind a single integration boundary, with schema enforcement at ingestion and stable API contracts at consumption.
What It Is Not
- Not a dashboard-first product — It is backend infrastructure. Dashboards and KPI roll-ups are available via the Partner API and Core Platform UI, but the primary interface is the SDK.
- Not a single forecasting model — It is a platform for managing many models across many sites, with versioning, A/B testing, and rollback.
- Not a CMMS — Work-order management, parts inventory, technician dispatch, and field-mobile tooling are out of scope. Where those are required, Ona integrates as the intelligence upstream feed.
- Not a consulting workflow — It is software you integrate with.
Integration
Install the SDK from GitHub and set your API key (contact support@asoba.org to get one).
# JavaScript
git clone https://github.com/AsobaCloud/sdk.git && cd sdk/javascript && npm install

# Python
git clone https://github.com/AsobaCloud/sdk.git && cd sdk/python && pip3 install -e .
Inverter Telemetry API
Query and stream live power output, energy, and state data from solar inverters.
Python:
from ona_platform import OnaClient
from ona_platform.models.telemetry import TimeRange
import os

client = OnaClient(
    inverter_telemetry_endpoint=os.environ["INVERTER_TELEMETRY_ENDPOINT"],
    inverter_telemetry_api_key=os.environ["INVERTER_TELEMETRY_API_KEY"],
)

# Query historical data
records = client.inverter_telemetry.get_inverter_telemetry(
    asset_id="INV-1000000054495190",
    site_id="Sibaya",
    time_range=TimeRange(start="2025-11-01T00:00:00", end="2025-11-01T12:00:00"),
    resolution="5min",
    limit=100,
)

# Stream live data
for record in client.inverter_telemetry.stream_inverter(
    asset_id="INV-1000000054495190",
    site_id="Sibaya",
    polling_interval=30,
):
    print(f"{record.timestamp}: {record.power} kW")
JavaScript:
const { OnaSDK } = require('./src/index');

const sdk = new OnaSDK({
  endpoints: { inverterTelemetry: process.env.INVERTER_TELEMETRY_ENDPOINT },
  inverterTelemetryApiKey: process.env.INVERTER_TELEMETRY_API_KEY,
});

const records = await sdk.inverterTelemetry.getInverterTelemetry({
  asset_id: "INV-1000000054495190",
  site_id: "Sibaya",
  time_range: { start: "2025-11-01T00:00:00", end: "2025-11-01T12:00:00" },
  limit: 100,
});

for await (const record of sdk.inverterTelemetry.streamInverter({
  asset_id: "INV-1000000054495190",
  site_id: "Sibaya",
  polling_interval: 30,
})) {
  console.log(`${record.timestamp}: ${record.power} kW`);
}
OODA Terminal Alerts API
Query and stream fault detection and diagnostic alerts from terminal devices.
Python:
from ona_platform.models.ooda import TimeRange

client = OnaClient(
    ooda_terminal_endpoint=os.environ["OODA_TERMINAL_ENDPOINT"],
    ooda_terminal_api_key=os.environ["OODA_TERMINAL_API_KEY"],
)

alerts = client.ooda_terminal.get_terminal_alerts(
    terminal_device_id="TERM-1000000054495190",
    site_id="Sibaya",
    time_range=TimeRange(start="2025-11-01T00:00:00", end="2025-11-01T12:00:00"),
)

for alert in client.ooda_terminal.stream_terminal(
    terminal_device_id="TERM-1000000054495190",
    site_id="Sibaya",
    polling_interval=30,
):
    print(f"{alert.timestamp}: [{alert.alert_severity}] {alert.message}")
JavaScript:
const sdk = new OnaSDK({
  endpoints: { oodaTerminal: process.env.OODA_TERMINAL_ENDPOINT },
  oodaTerminalApiKey: process.env.OODA_TERMINAL_API_KEY,
});

for await (const alert of sdk.oodaTerminal.streamTerminal({
  terminal_device_id: "TERM-1000000054495190",
  site_id: "Sibaya",
  polling_interval: 30,
})) {
  console.log(`${alert.timestamp}: [${alert.alert_severity}] ${alert.message}`);
}
Live Endpoints
| API | Endpoint |
|---|---|
| Inverter Telemetry | https://af5jy5ob3e.execute-api.af-south-1.amazonaws.com/prod |
| OODA Terminal Alerts | https://3lpq00xevg.execute-api.af-south-1.amazonaws.com/prod |
| Partner API | https://8el3o25tc1.execute-api.af-south-1.amazonaws.com/prod |
Deployment Options
SaaS (Managed Infrastructure)
Cloud-hosted with managed infrastructure.
- API-based data uploads
- Automatic updates and maintenance
- 99.9% uptime SLA
On-Premises (Self-Hosted)
Local installation for data sovereignty requirements.
- Complete data control
- Offline operation capability
- Optional hardware bundle (mini compute cluster + data logger)
Getting Started
Week 1–2: Integration
Connect SCADA/inverters via ODSE connectors, ingest historical data, establish performance baselines.
Week 3–12: Optimisation
Real-time monitoring goes live. Weekly performance reports as models continuously improve.
Week 13: Decision
Executive ROI analysis. Automatic conversion upon meeting metrics, followed by scale-up.
Support & Resources
Documentation
Support
- Email: support@asoba.org
- Discord: Join our community
- Documentation: docs.asoba.org
Get Help & Stay Updated
Contact Support
For technical assistance, feature requests, or any other questions, please reach out to our dedicated support team.
Email Support Join Discord